Links
Data
UCDAVIS plone
 https://dendrome.ucdavis.edu/TGPlone/research-projects/pinerefseq
 dpuiu
 ddr5fft6
 https://dendrome.ucdavis.edu/TGPlone/research-projects/pinerefseq/files/library-and-flow-cell-data/prs-tracking-database-archive/
IPST ftp
 ftp genomepc1.umd.edu
 ftpuser
 pinegenome

 cd PineUpload052911/
 bin
 prompt             # no Y/N?
 mget *
Local data
 ginkgo:
 /fs/szattic-asmg7/PINE/PineUpload052911
 /fs/szattic-asmg7/PINE/PineUpload070711
PineUpload052911
Chloroplast
                len      gc%
 cChloroplast   120481   38.55
cBACs
 .       elem       min    q1     q2     q3     max        mean       n50        sum
 len     102        8288   89909  116121 140549 172161     113400     126689     11566806
 gc%     102        34.44  36.56  37.61  38.80  52.88      37.94      37.66      3870.87
Reads
 lane           readLen   #mates        mea,std      ~gc%
 FC638TR_001_8  146       22,729,231    400           39.04
 FC638TR_002_8  146       18,412,638    400           39.04
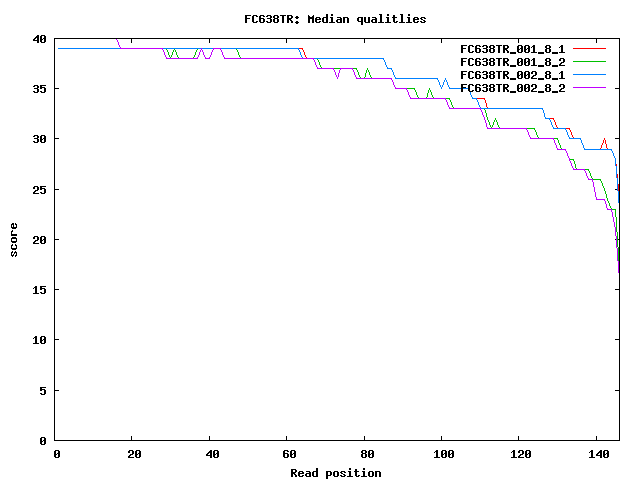
- Quality decreases sharply after pos 120
FC638TR.qual.png
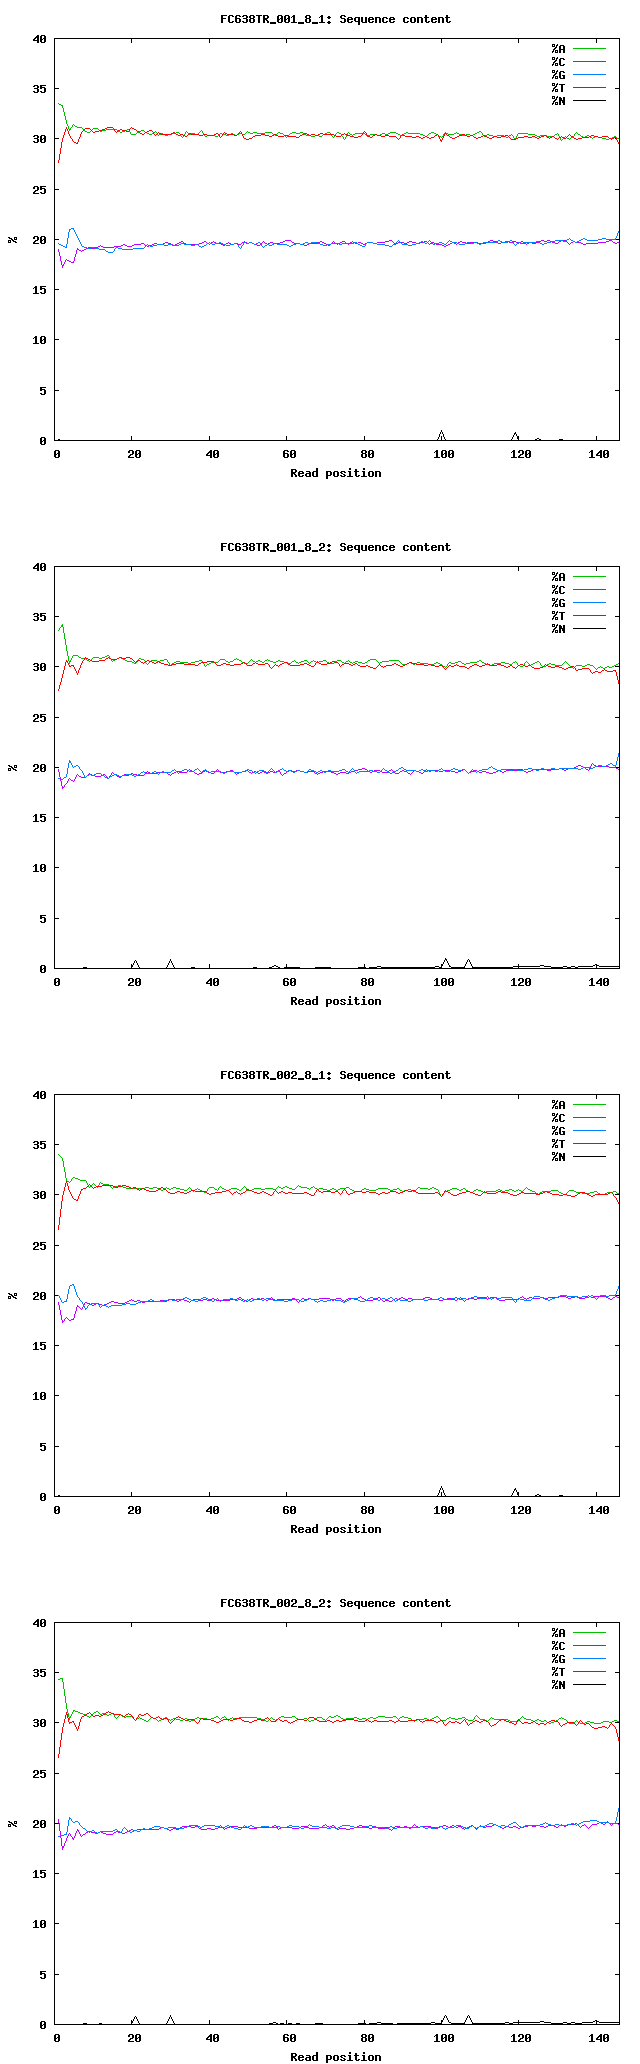
- First 10bp of each read have higher AG count
FC638TR.content.png
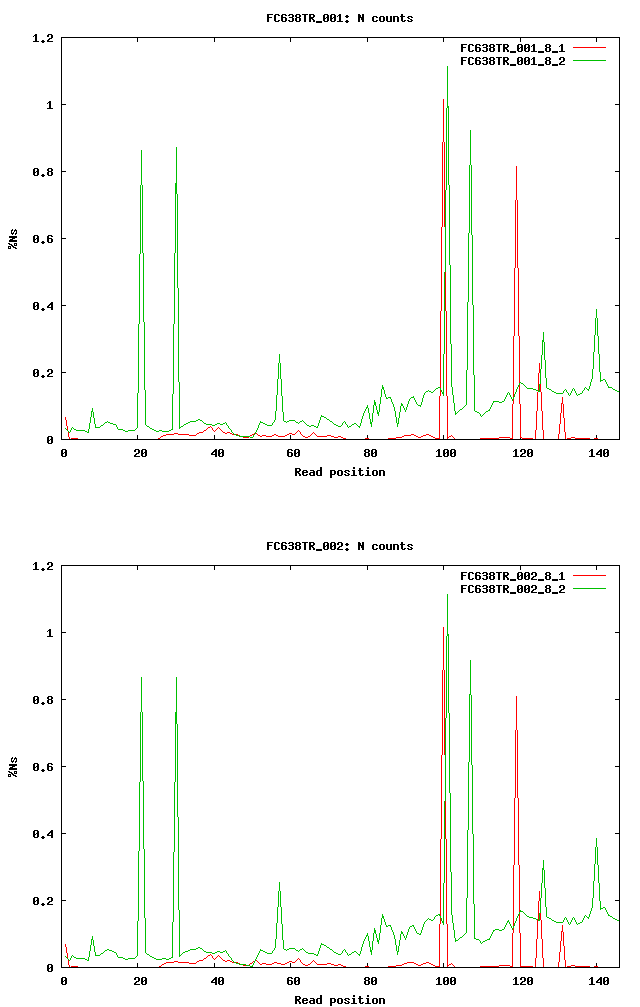
- Over 0.5% Ns certain positions
 fwd: 1.015% pos=100 ; 0.81% pos=119
 rev: 1.114% pos=101 ; 0.92% pos=107 ; 0.87% pos=30; 0.21% pos 21
FC638TR.Ns.png
- GC% variation: cBAC < cChloroplast < reads
- cCholoplast alignments (bwasw)
 lane                  #hits   %hits
 FC638TR_001_8_1	475254	2.09
 FC638TR_001_8_2	473331	2.08
 FC638TR_002_8_1	1009331	5.48
 FC638TR_002_8_2	1004341	5.45
 lane                  #hits   %hits
 FC638TR_001_8_1	9722204	42.77
 FC638TR_001_8_2	9481188	41.71
 FC638TR_002_8_1	7684164	41.73
 FC638TR_002_8_2	7469151	40.56
Sampled reads
- 100K sampled reads from each library (2*2*100K=400K)
 .       elem       min    q1     q2     q3     max        mean       n50        sum
 gc%     400000     0.68   34.93  39.04  43.15  95.89      39.20      40.41      .
- FC638TR_001_8_1 alignments
 ref            qry               aligner      #hits      %hits   %identity(median)
 cBAC           FC638TR_001_8_1   bwasw        42971      43
                                  nucmer       12477      12.5    95
                                  bowtie       1186       1.2%
 cChloroplast                     bwasw        2031       2%
                                  nucmer       1943       1.9%    100
                                  bowtie       1490       1.5%
- FC638TR_00[12]_8_[12] bwa alignments
 ref            qry               aligner      #hits      %hits
 cBAC           FC638TR_001_8_1   bwasw        42971      43
                FC638TR_001_8_2                41915      42
                FC638TR_002_8_1                42128      42
                FC638TR_002_8_2                40606      41

 cChloroplast   FC638TR_001_8_1                2031       2
                FC638TR_001_8_2                2033       2
                FC638TR_002_8_1                5370       5.3
                FC638TR_002_8_2                5330       5.3
Assembly
SOAPdenovo
 #scaffold with gaps stats
 .                                     elem       min    q1     q2     q3     max        mean       n50        sum
 -K47           -max_rd_len 100        211820     100    143    156*   187    23273      227.95     .          48284629
 -K31           -max_rd_len 100        13747338   100    100    100    100    9185       108.04     .          1485269562
 -K31 -d 2 -D 3 -max_rd_len 100        74820      100    105    125    390    31673*     320.75     .          23998536*
 -K27 -d 2 -D 3 -max_rd_len 100        70246*     100    107    137    413*   30683      369.81     .          25977758
 -K27 -d 2 -D 2 -max_rd_len 146        224963     100    110    128    343    23410      260.64     .          58635190
 SOAPdenovo-31mer -K 27 -d 2 -D 3 -max_rd_len 100 : best
 #scaffold stats
 .                          elem   min    q1     q2     q3     max    mean     n50    sum
 all                        70246  100    107    137    413    30683* 369.81   .      25977758
 ctg                        8641885 28    28     31     37     7238   36.1     .      312425669
Alignment1
 nucmer default parameters
 # Legend:
 all                        : all SOAPdenovo scaffolds
 cBAC                       : scaffolds aligned to cBACs
 cChloroplast               : scaffolds aligned to cChloroplast
 mito                       : scaffolds aligned to at least one of the 31 complete plant mitochondrion sequence
 mito.Cycas_taitungensis    : scaffolds aligned to at least one of the Cycas_taitungensis mitochondrion sequence (most hits)
 other                      : unaligned scaffolds
 # scaffold length stats
 .                          elem   min    q1     q2     q3     max    mean     n50    sum
 all                        70246  100    107    137    413    30683  369.81   .      25977758
 cBAC                       1839   100    124    242    625    23267  637.13   .      1171678
 cChloroplast               73     100    117    139    185    416    161.47   .      11787
 mito                       68     131    867    2274   7241   30683  4675.18  .      317912
 mito.Cycas_taitungensis    64     111    844    1931   7114   30683* 4529.91  .      289914
 other                      68266  100    106    136    412    26715  358.54   .      24476381
 #scaffold gc stats
 .                          elem   min    q1     q2     q3     max    mean     n50    sum
 all                        70246  4.90   35.40  40.74  44.52  74.26  39.78    .      .
 cBAC                       1839   10.64  35.63  41.22  44.87  74.26  39.95    .      .
 cChloroplast               73     25.65  31.09  33.33  36.89  42.31  33.76    .      .
 mito                       68     43.08  45.96  47.45  49.19  56.41  47.77    .      .
 mito.Cycas_taitungensis    64     41.44  46.27  47.81  50.00  56.41  48.16    .      .
 other                      68266  4.90   35.40  40.71  44.50  70.00  39.77    .      .
- The longest assembled scaffold was 30683bp and aligned to the mitochondrion database.
- The mitochondrion gc% seems to be significantly higher than the one of rest of the genome (48% vs 40%)
- The Cycas taitungensis mitochondrion (414903bp, 46.92%gc) had the most scaffolds aligned to it (64 out of 68).
 # Mitochondrial scaffolds
 .                    elem       min    q1     q2     q3     max        mean       n50        sum
 scf                  68         131    867    2274   7241   30683      4675.18    9407       317912          # used for alignment
 scf.gc%              68         43.08  45.96  47.45  49.19  56.41      47.77      47.45      3248.1
 scf.noGaps           68         131    743    2049   6660   27931      4262.46    9052       289847
- Reads aligned to mitochondrial scaffolds (bwa bwasw)
 lane               #hits  %hits
 FC638TR_001_8_1    12307  0.054
 FC638TR_001_8_2    11933
 FC638TR_002_8_1    28707  0.12
 FC638TR_002_8_2    27211
 total              80158          # 20X cvg for 100bp read len & 400K mito genome ; 29X  cvg for 146bp read len
Alignment2
nucmer -l 20 -c 20; delta-filter -l 65 -q -o 75 ; filter for gc% >=44
 # Mitochondrial scaffolds
 .                    elem       min    q1     q2     q3     max        mean       n50        sum
 scf.len              102        101    608    1931   7271   30683      5044.88    11204      514578
 scf.gc%              102        44.07  46.12  47.45  49.33  56.41      48.05      47.47      4901.06
lane               #hits  %hits
FC638TR_001_8_1    18614
FC638TR_001_8_2    18035
FC638TR_002_8_1    43961
FC638TR_002_8_2    42101
total              122707            # 30X cvg for 100bp read len & 400K mito genome
PineUpload070711
Ecoli
                len     gc%
 cE_coli        4639675 50.79
Cloning vector
                len    gc%
 pFosDT5_2      8345   47.93
Drosophila refseq
 Chromosome      len            gc%
 2L              23,011,544     41
 2R              21,146,708     43
 3L              24,543,557     41
 3R              27,905,053     42
 4               1,351,857      35
 X               22,422,827     42
 un              10,049,037     ?
 mitochondrion   19,517         17
 total           137,586,636    ?     # actually the chromosome lengths sum to 130,450,100
Reads (Drosophila)
 lib                      readLen  #mates    mea,std   ~gc%
 FC70M6V_6_001            160,156  23546475  343,30    42.5

 TIL_242_FC70M6V_2_002    160,156  9917211   242       .
 TIL_242_FC70M6V_3_002    160,156  6276300   242

 TIL_254_FC70M6V_2_004    160,156  9279789   254        .
 TIL_254_FC70M6V_3_004    160,156  5924239   254

 TIL_270_FC70M6V_2_003    160,156  10188776  270        .
 TIL_270_FC70M6V_3_003    160,156  6556676   270

 TIL_288_FC70M6V_2_001    160,156  9524524   288        .
 TIL_288_FC70M6V_3_001    160,156  6158919   288
- kastevens@ucdavis.edu:
- The files labeled TIL_XXX_FC70M6V_Y_00Z, are Drosophila libraries with a median target insert size of XXX. They come in pairs and can be merged.
- Regarding pairing, each insert size was run in two lanes Y at two different concentrations.
- Lane 3, with the lower concentration, should have higher quality data than lane 2 but with a higher cost per bp.
- The loss in quality was quantitativly small, so we don't expect the extra expense of lowering the concentration will be justified empirically.
- The first library, FC70M6V_6_001, is a ~40x library created from a pool of ~1000 fosmids. In general, we do not put the insert size in the filename.
- However, we did estimate the insert size to be 343bp with a below median standard deviation of 30. So roughly 15% of the inserts are < 313bp and have > 3bp overlap. This seems to fit well with your result.
- Each lane is multiplexed into sub-lanes indicated by 00Z. So the amount of reads in the file is variable and not nessesarily reflective of the cluster density.
- The Drosophila libraries were each run in 1/4 lane and the fosmid pool was run in 1/2 lane. The pool has roughy double the sequence content of the
- Drosophila libraries run in lane 2 at nominal density.