Pine tree: Difference between revisions
| Line 201: | Line 201: | ||
== SOAPdenovo-31mer -K 31 -d 2 -max_rd_len 100 == | == SOAPdenovo-31mer -K 31 -d 2 -max_rd_len 100 == | ||
#stats | #stats | ||
. elem | . elem min q1 q2 q3 max mean n50 sum | ||
scf | scf 20,441 100 124 374 1980 291,000 2575.50 0 52,645,707 | ||
ctg | ctg 802,463 32 33 39 63 73,415 91.13 0 73,131,767 | ||
edge | edge 1,013,801 1 2 7 32 30,919 48.85 0 49,525,815 | ||
reads 47,092,950 | |||
#scf alignments | #scf alignments | ||
. elem | . elem min q1 q2 q3 max mean n50 sum | ||
all | all 20,441 100 124 374 1980 291,000 2575.50 0 52,645,707 | ||
cE_coli 149 | cE_coli 149 100 325 6612 41908 291,000 30160.59 0 4,493,928 | ||
cpFosDT5_2 0 | cpFosDT5_2 0 | ||
cChloroplast 58 | cChloroplast 58 105 166 374 1950 24,932 1875.86 0 108,800 | ||
cBAC | cBAC 12,294 100 141 785 4204 45,781 3513.34 0 43,192,987 | ||
other 7953 | other 7953 100 113 171 599 41,416 619.60 0 4,927,664 | ||
== SOAPdenovo-31mer -K 31 -d 20 -max_rd_len 100 == | == SOAPdenovo-31mer -K 31 -d 20 -max_rd_len 100 == | ||
#stats | #stats | ||
. elem | . elem min q1 q2 q3 max mean n50 sum | ||
scf | scf 25,482 100 127 262 993 239,672 1339.89 0 34,143,040 | ||
ctg | ctg 265,450 32 34 50 121 49,599 143.69 0 38,141,459 | ||
edge | edge 530,926 1 3 11 40 41,918 63.06 0 33,477,999 | ||
#scf alignments | #scf alignments | ||
. elem | . elem min q1 q2 q3 max mean n50 sum | ||
all | all 25,482 100 127 262 993 239,672 1339.89 0 34,143,040 | ||
cE_coli 205 | cE_coli 205 100 252 2244 30571 239,672 21916.78 0 4,492,939 | ||
cpFosDT5_2 17 | cpFosDT5_2 17 100 118 171 272 855 275.24 0 4,679 | ||
cChloroplast 31 | cChloroplast 31 100 130 322 1363 5,717 986.52 0 30,582 | ||
cBAC | cBAC 15,668 100 133 336 1529 33,075 1559.92 0 24,440,863 | ||
other | other 9,574 100 117 171 522 27,341 542.74 0 5,196,233 | ||
Revision as of 17:47, 11 August 2011
Links
- dendrome@ucdavis
- pinegenome.org
- NCBI Taxonomy record Pinus taeda or "loblolly pine"
- LOBLOLLY PINE BAC LIBRARY@MSSTATE.EDU
- Adventures in the enormous: a 1.8 million clone BAC library for the 21.7 Gb genome of loblolly pine. PLoS One Jan 2011
Abstract: Loblolly pine (LP; Pinus taeda L.) is the most economically important tree in the U.S. and a cornerstone species in southeastern forests. However, genomics research on LP and other conifers has lagged behind studies on flowering plants due, in part, to the large size of conifer genomes. As a means to accelerate conifer genome research, we constructed a BAC library for the LP genotype 7-56. The LP BAC library consists of 1,824,768 individually-archived clones making it the largest single BAC library constructed to date, has a mean insert size of 96 kb, and affords 7.6X coverage of the 21.7 Gb LP genome. To demonstrate the efficacy of the library in gene isolation, we screened macroarrays with overgos designed from a pine EST anchored on LP chromosome 10. A positive BAC was sequenced and found to contain the expected full-length target gene, several gene-like regions, and both known and novel repeats. Macroarray analysis using the retrotransposon IFG-7 (the most abundant repeat in the sequenced BAC) as a probe indicates that IFG-7 is found in roughly 210,557 copies and constitutes about 5.8% or 1.26 Gb of LP nuclear DNA; this DNA quantity is eight times the Arabidopsis genome. In addition to its use in genome characterization and gene isolation as demonstrated herein, the BAC library should hasten whole genome sequencing of LP via next-generation sequencing strategies/technologies and facilitate improvement of trees through molecular breeding and genetic engineering. The library and associated products are distributed by the Clemson University Genomics Institute (www.genome.clemson.edu).
Data
NCBI
- SRA traces BAC 454 reads
- BAC assembled sequences : AC241263..AC241361, HQ141589, GU477256..GU477266
- Plant mitochondrion finished sequences
 .      elem    min    q1      q2      q3      max      mean     sum
 len    31      45223  209482  414903  539368  982833   402851   12488404
 gc%    31      32.80  43.73   43.93   44.98   46.92    43.41    .
- Cycas taitungensis has the most similar mitochondrion
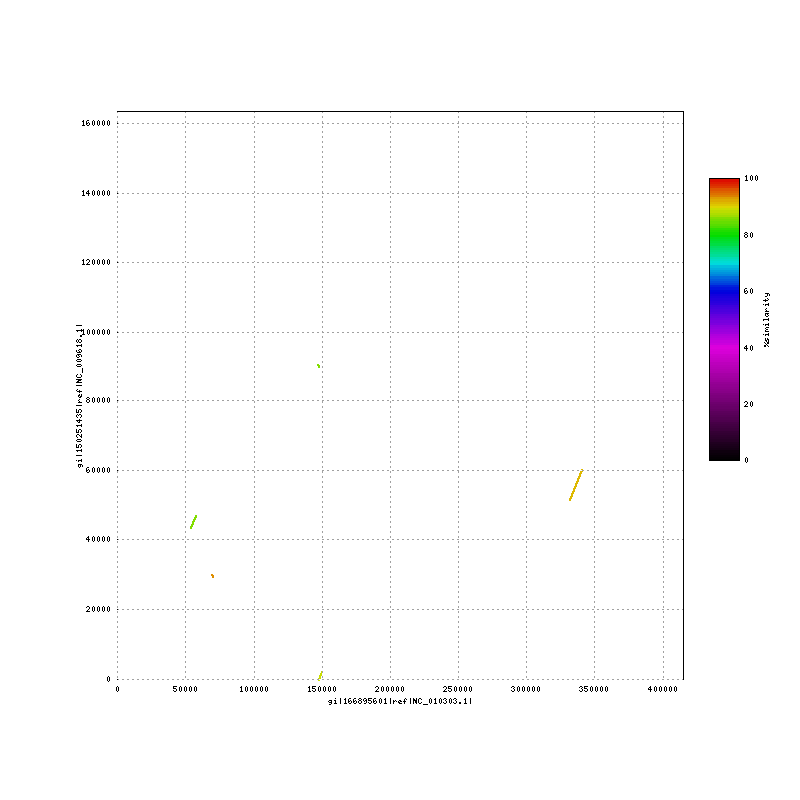
 NC_009618	chloroplast     163,403
 NC_010303	mitochondrion   414,903
 mitochondrion vs chloroplast:  Cycas_taitungensis_mito-chloroplast.png
UCDAVIS plone
- Links
 https://dendrome.ucdavis.edu/TGPlone/research-projects/pinerefseq
 dpuiu
 ddr5fft6
 https://dendrome.ucdavis.edu/TGPlone/research-projects/pinerefseq/files/library-and-flow-cell-data/prs-tracking-database-archive/
- Documents
- PRS_experiment_agenda_2011-07-28_05-43pm_PDT.ods 21 July 2011
IPST ftp
 ftp genomepc1.umd.edu
 ftpuser
 pinegenome

 cd PineUpload052911/
 bin
 prompt             # no Y/N?
 mget *
Local data
 ginkgo:
 /fs/szattic-asmg7/PINE/PineUpload052911
 /fs/szattic-asmg7/PINE/PineUpload070711
PineUpload052911
Chloroplast
                len      gc%
 cChloroplast   120481   38.55
cBACs
 .       elem       min    q1     q2     q3     max        mean       n50        sum
 len     102        8288   89909  116121 140549 172161     113400     126689     11566806
 gc%     102        34.44  36.56  37.61  38.80  52.88      37.94      37.66      3870.87
Reads
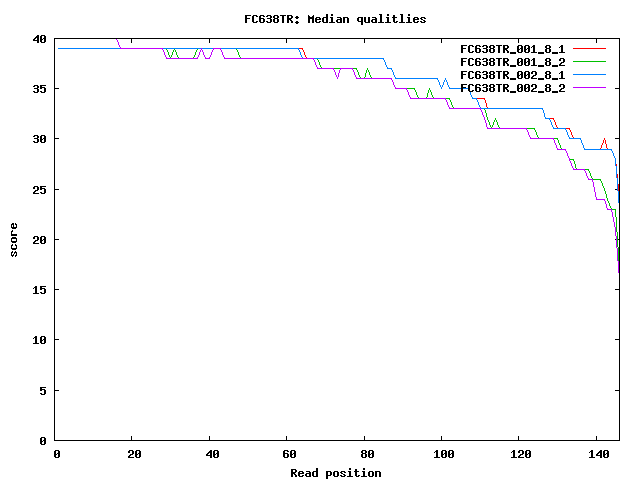
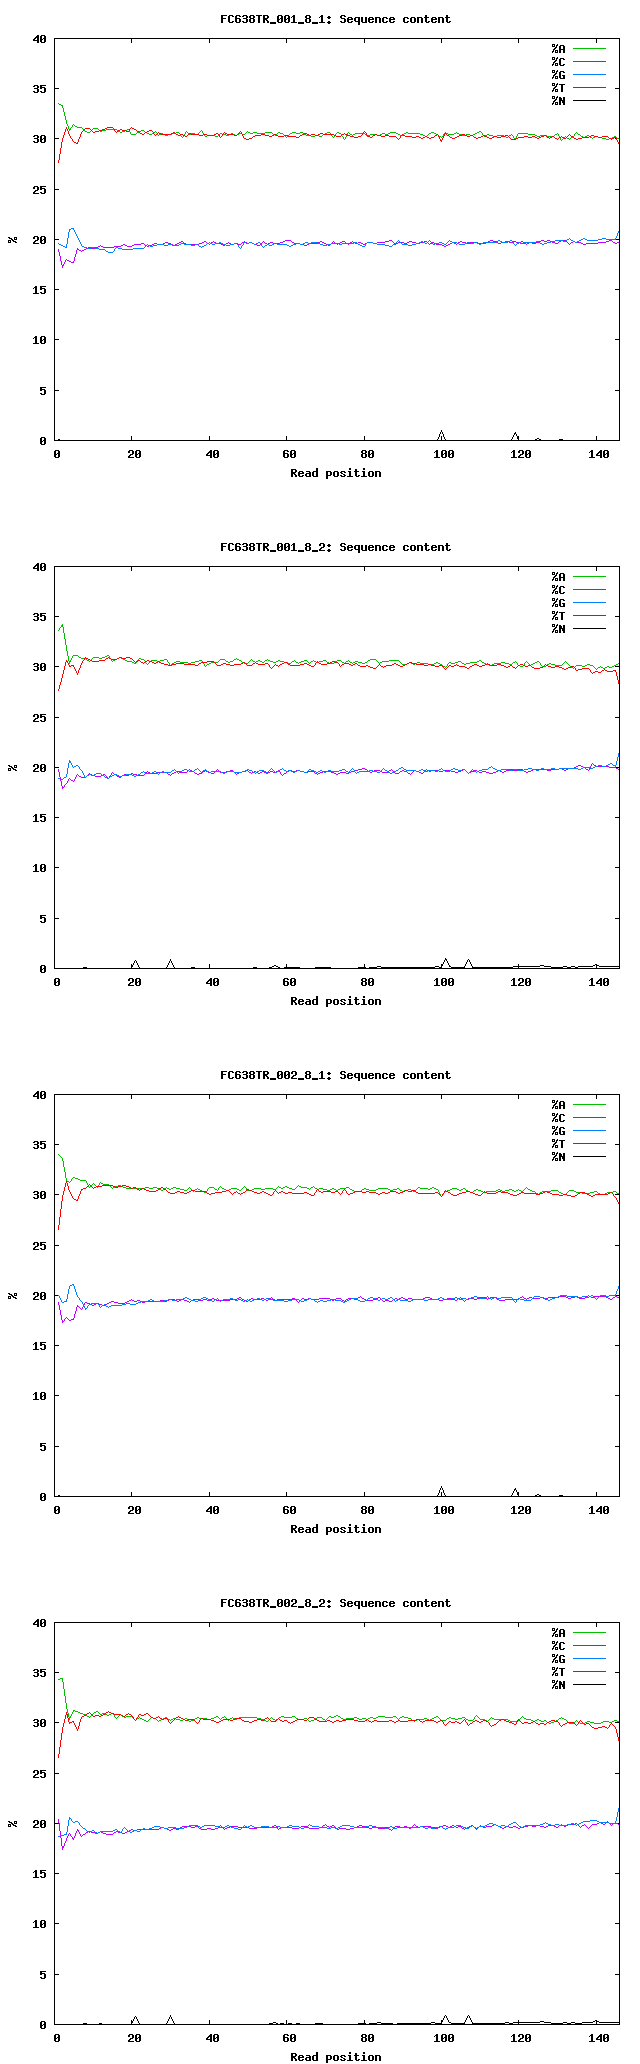
 lane           readLen   #mates        mea,std      ~gc%
 FC638TR_001_8  146       22,729,231    400           39.04
 FC638TR_002_8  146       18,412,638    400           39.04
- Quality decreases sharply after pos 120 FC638TR.qual.png
- First 10bp of each read have higher AG count FC638TR.content.png
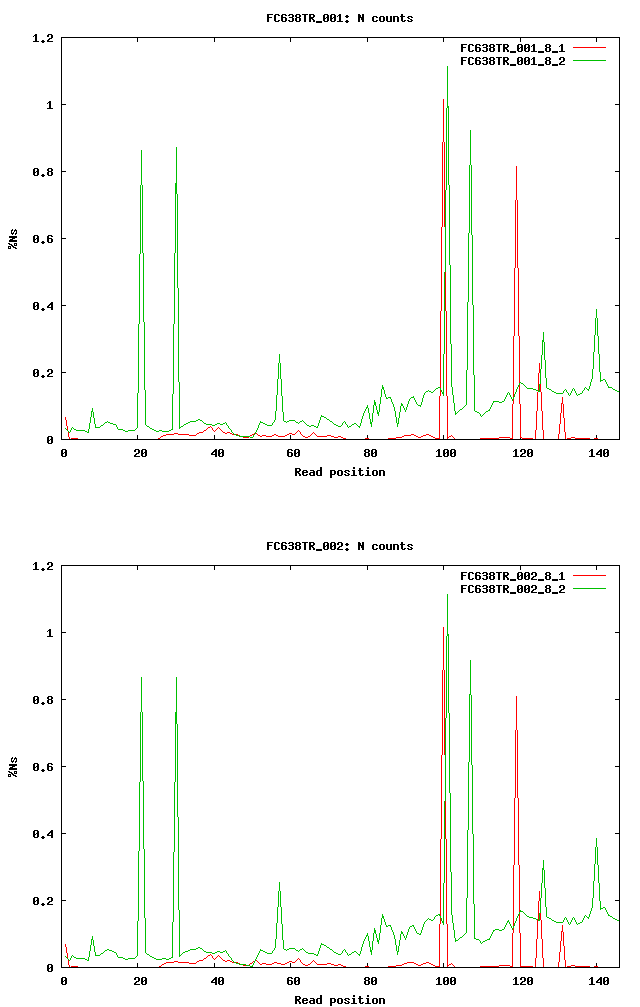
- Over 0.5% Ns certain positions FC638TR.Ns.png
 fwd: 1.015% pos=100 ; 0.81% pos=119
 rev: 1.114% pos=101 ; 0.92% pos=107 ; 0.87% pos=30; 0.21% pos 21
- GC% variation: cBAC(37.5%) < cChloroplast(38.5%) < reads(39%) < mito (44%+)
- Contamination:
 lane                   #reads       #cChloroplast   #cBAC               #mito
 FC638TR_001_8_1	22,729,231   468,309(2%)     9,533,849(42.7%)    12715(0.056%)
 FC638TR_001_8_2	22,729,231   466,185(2%)     9,303,475(41.7%)    12291
 FC638TR_002_8_1	18,412,638   995,291(5.4%)   7,535,809(41.7%)    30839 (0.16%)
 FC638TR_002_8_2	18,412,638   990,122(5.4%)   7,330,078(40.5%)    29444
 total                                                                   85289             # ~21X cvg for 100bp read len & 400K mito genome
- alignments:
 program: bwa bwasw
 cChloroplast ref: 1 seq
 cBAC:             101 seqs
 mito:             83 scaffolds ~358162bp
SOAPdenovo's
 #scaffold stats
 .                                elem        min    q1     q2     q3     max        mean       n50        sum
 -K31 -d0  -max_rd_len100         13,747,338  100    100    100    100    9,185      108.04     .          1,485,269,562

 -K31 -d2  -max_rd_len72          28,934      100    111    136    426    23,376     378.53*    0          10,952,507
 -K31 -d2  -max_rd_len100         74,820      100    105    125    390    31,673     320.75     .          23,998,536
 -K31 -d2  -max_rd_len146         224,963     100    110    128    343    23,410     260.64     .          58,635,190
 -K31 -d20 -max_rd_len100         7,859*      100    113    139    284    43,079     331.49     .          2,605,184
 -K31 -d48 -max_rd_len100         3,626       100    113    139    255    43,131*    339.01     .          1,229,250
 -K47 -d0  -max_rd_len100         211,820     100    143    156*   187    23,273     227.95     .          48,284,629
 -K47 -d2  -max_rd_len100         61,152      100    121    151    200    30,846     286.05     0          17,492,450
SOAPdenovo-31mer -K 31 -d 2 -max_rd_len 100
 #stats
 .               elem        min  q1   q2    q3    max    mean     n50  sum           readOnContig
 scf             74,820      100  105  125   390   31,673 320.75   0    23,998,536
 ctg             5,755,282   32   32   35    43    7,195  41.63    0    239,620,204   33,083,609(40%)
 edge            11,015,468  1    2    4     11    7,164  8.75     0    96,380,983
 reads           82,283,738                                             6,006,712,874
 #scf alignments
 .               elem      min  q1   q2    q3    max     mean     n50  sum
 all             74,820    100  105  125   390   31,673  320.75   0    23,998,536
 cChloroplast    206       100  122  159   229   767     191.56   0    39,462       # VERY BAD
 cBAC            10,533    100  113  143   428   26,589  477.68   0    5,031,439
 mito            83        105  448  1730  6851  26,364  4315.20  0    358,162
 other           63,998    100  104  122   382   31,673  290.16   0    18,569,473   # align to mito database ; Cycas_taitungensis was top hit
 other.long.hiGC 45        5066 6717 8233  10488 31,673  9662.07  0    434,793
SOAPdenovo-31mer -K 31 -d 20 -max_rd_len 100
 #stats
 .               elem      min  q1   q2    q3    max     mean     n50  sum          readOnContig
 scf             7,859     100  113  139   284   43,079* 331.49   .    2,605,184
 ctg             200,062   32   33   37    47    10,392  48.52    .    9,707,307    19,002,331(23%)
 reads           82,283,738
 #scf alignments
 .               elem      min  q1   q2    q3    max     mean     n50  sum
 all             7,859*    100  113  139   284   43,079* 331.49   .    2,605,184
 cChloroplast    20        111  193  436   6140  43,079  5951.05  0    119,021      # MUCH BETTER
 cBAC            5,117     100  114  141   320   13,733  334.94   0    1,713,870
 mito            8         101  134  685   1396  2,166   749.75   0    5,998        # VERY BAD
 other           2,714     100  111  133   226   7,353   282.35   0    766,295
SOAPdenovo-31mer -K 31 -d 48 -max_rd_len 100 choloplast_mated_reads
 #scaffold stats
 .               elem      min  q1   q2    q3    max    mean     n50  sum
 scf             20        111  193  436   6140  42707  5928.20  0    118564
PineUpload070711
Ecoli
                len     gc%
 cE_coli        4639675 50.79
Cloning vector
                len    gc%
 pFosDT5_2      8345   47.93
Drosophila refseq
 Chromosome      len            gc%
 2L              23,011,544     41
 2R              21,146,708     43
 3L              24,543,557     41
 3R              27,905,053     42
 4               1,351,857      35
 X               22,422,827     42
 un              10,049,037     ?
 mitochondrion   19,517         17
 total           137,586,636    ?     # actually the chromosome lengths sum to 130,450,100
Reads
 lib                      readLen  #reads    #cE_coli         #pFosDT5_2       #cChloroplast  #cBAC
 FC70M6V_6_001_1          160      23546475  2931496(12.44%)  5473141(23.24%)  24148(0.10%)   7739576(32.86%)
 FC70M6V_6_001_2          156      23546475  2885406(12.25%)  5854468(24.86%)  21794(0.09%)   7520343(31.93%)
 lib                      readLen  #mates    mea,std   ~gc%  %merged(Tanja) %cE_coli %cpFosDT5_2 %cChloro  %cBAC  %pBAC-DE %other
 FC70M6V_6_001            160,156  23546475  343,30    42.5                 12.5%    24%         0.09%     32.5   19.3          # sampled 100K

 TIL_242_FC70M6V_2_002    160,156  9917211   242       .      91.4%
 TIL_242_FC70M6V_3_002    160,156  6276300   242              92.7%

 TIL_254_FC70M6V_2_004    160,156  9279789   254        .     91.5%
 TIL_254_FC70M6V_3_004    160,156  5924239   254              92.9%

 TIL_270_FC70M6V_2_003    160,156  10188776  270        .     88.1%
 TIL_270_FC70M6V_3_003    160,156  6556676   270              90.3%

 TIL_288_FC70M6V_2_001    160,156  9524524   288        .     80.0%
 TIL_288_FC70M6V_3_001    160,156  6158919   288              83.0%
- kastevens@ucdavis.edu:
- The files labeled TIL_XXX_FC70M6V_Y_00Z, are Drosophila libraries with a median target insert size of XXX. They come in pairs and can be merged.
- Regarding pairing, each insert size was run in two lanes Y at two different concentrations.
- Lane 3, with the lower concentration, should have higher quality data than lane 2 but with a higher cost per bp.
- The loss in quality was quantitativly small, so we don't expect the extra expense of lowering the concentration will be justified empirically.
- The first library, FC70M6V_6_001, is a ~40x library created from a pool of ~1000 fosmids. In general, we do not put the insert size in the filename.
- However, we did estimate the insert size to be 343bp with a below median standard deviation of 30. So roughly 15% of the inserts are < 313bp and have > 3bp overlap. This seems to fit well with your result.
- Each lane is multiplexed into sub-lanes indicated by 00Z. So the amount of reads in the file is variable and not nessesarily reflective of the cluster density.
- The Drosophila libraries were each run in 1/4 lane and the fosmid pool was run in 1/2 lane. The pool has roughy double the sequence content of the
- Drosophila libraries run in lane 2 at nominal density.
SOAPdenovo-31mer -K 31 -d 2 -max_rd_len 100
 #stats
 .               elem      min  q1   q2    q3     max      mean      n50  sum
 scf             20,441    100  124  374   1980   291,000  2575.50   0    52,645,707
 ctg             802,463   32   33   39    63     73,415   91.13     0    73,131,767
 edge            1,013,801 1    2    7     32     30,919   48.85     0    49,525,815
 reads           47,092,950
 #scf alignments
 .               elem      min  q1   q2    q3     max      mean      n50  sum
 all             20,441    100  124  374   1980   291,000  2575.50   0    52,645,707
 cE_coli         149       100  325  6612  41908  291,000  30160.59  0    4,493,928
 cpFosDT5_2      0
 cChloroplast    58        105  166  374   1950   24,932   1875.86   0    108,800
 cBAC            12,294    100  141  785   4204   45,781   3513.34   0    43,192,987
 other           7953      100  113  171   599    41,416   619.60    0    4,927,664
SOAPdenovo-31mer -K 31 -d 20 -max_rd_len 100
 #stats
 .               elem      min  q1   q2    q3     max      mean      n50  sum
 scf             25,482    100  127  262   993    239,672  1339.89   0    34,143,040
 ctg             265,450   32   34   50    121    49,599   143.69    0    38,141,459
 edge            530,926   1    3    11    40     41,918   63.06     0    33,477,999
 #scf alignments
 .               elem      min  q1   q2    q3     max      mean      n50  sum
 all             25,482    100  127  262   993    239,672  1339.89   0    34,143,040
 cE_coli         205       100  252  2244  30571  239,672  21916.78  0    4,492,939
 cpFosDT5_2      17        100  118  171   272    855      275.24    0    4,679
 cChloroplast    31        100  130  322   1363   5,717    986.52    0    30,582
 cBAC            15,668    100  133  336   1529   33,075   1559.92   0    24,440,863
 other           9,574     100  117  171   522    27,341   542.74    0    5,196,233